Note
Click here to download the full example code
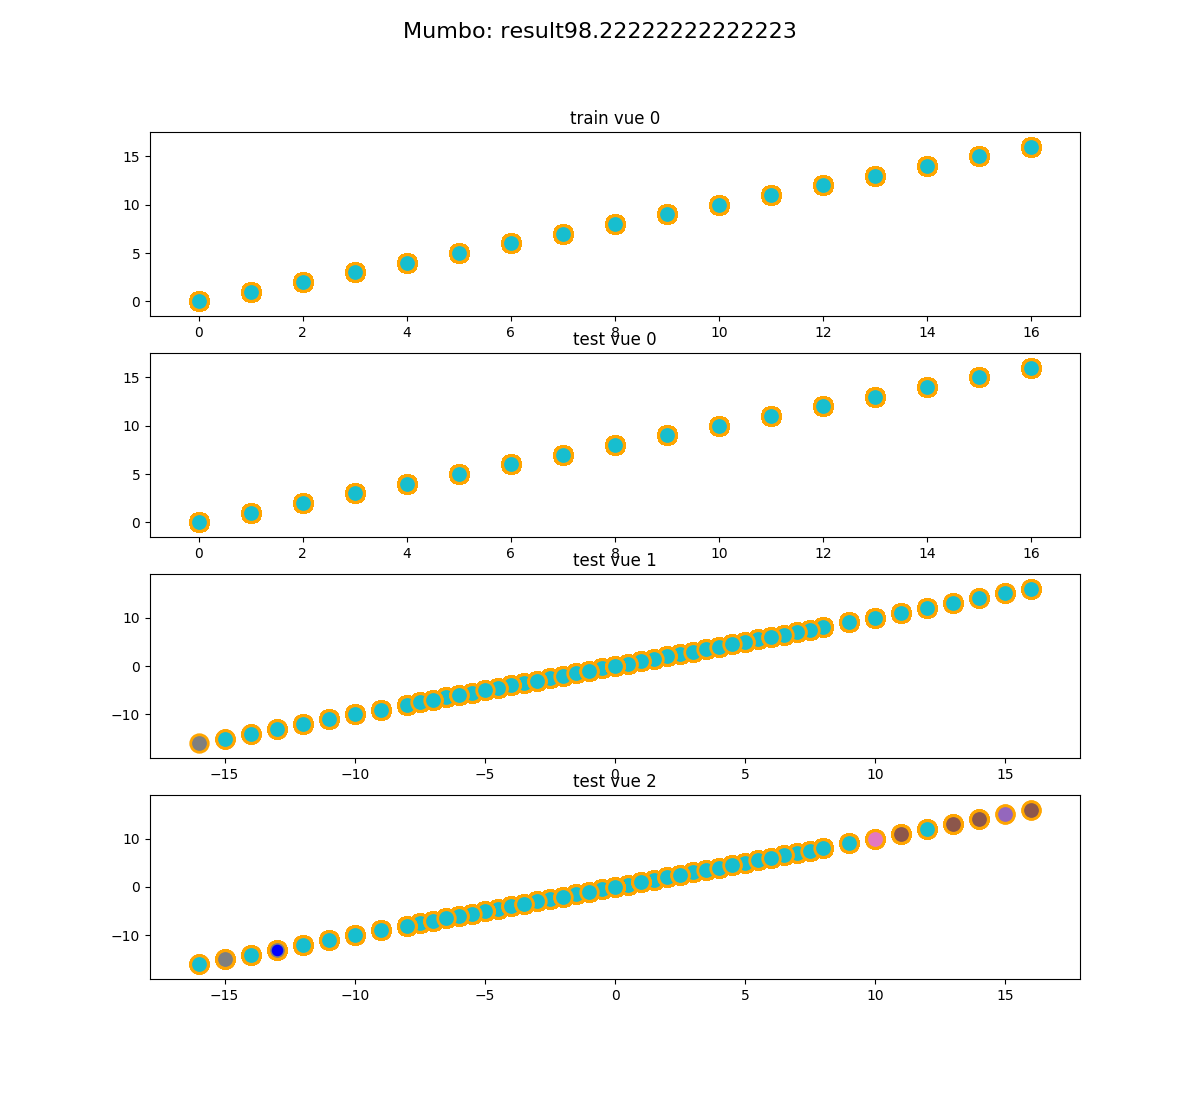
Use Case MumBo on digit
Use case for all classifier of multimodallearn MumBo
- multi class digit from sklearn, multivue
vue 0 digit data (color of sklearn)
vue 1 gradiant of image in first direction
vue 2 gradiant of image in second direction
Out:
/home/dominique/.virtualenvs/env_multiv/local/lib/python3.6/site-packages/sklearn/ensemble/weight_boosting.py:29: DeprecationWarning: numpy.core.umath_tests is an internal NumPy module and should not be imported. It will be removed in a future NumPy release.
  from numpy.core.umath_tests import inner1d
result of MumboClassifier on digit
98.22222222222223
/home/dominique/projets/ANR-Lives/scikit-multimodallearn/examples/usecase/plot_usecase_exampleMumBo.py:73: UserWarning: Matplotlib is currently using agg, which is a non-GUI backend, so cannot show the figure.
  plt.show()
import numpy as np
import matplotlib.pyplot as plt
from sklearn.model_selection import train_test_split
from sklearn.tree import DecisionTreeClassifier
from multimodal.datasets.base import load_dict, save_dict
from multimodal.tests.data.get_dataset_path import get_dataset_path
from multimodal.datasets.data_sample import MultiModalArray

from multimodal.boosting.mumbo import MumboClassifier

import numpy as np
import matplotlib.pyplot as plt
import matplotlib._color_data as mcd


def plot_subplot(X, Y, Y_pred, vue, subplot, title):
    cn = mcd.CSS4_COLORS
    classes = np.unique(Y)
    n_classes = len(np.unique(Y))
    axs = plt.subplot(subplot[0],subplot[1],subplot[2])
    axs.set_title(title)
    #plt.scatter(X._extract_view(vue), X._extract_view(vue), s=40, c='gray',
    #            edgecolors=(0, 0, 0))
    for index, k in zip(range(n_classes), cn.keys()):
         Y_class, = np.where(Y==classes[index])
         Y_class_pred = np.intersect1d(np.where(Y_pred==classes[index])[0], np.where(Y_pred==Y)[0])
         plt.scatter(X._extract_view(vue)[Y_class],
                     X._extract_view(vue)[Y_class],
                     s=40, c=cn[k], edgecolors='blue', linewidths=2, label="class real class: "+str(index)) #
         plt.scatter(X._extract_view(vue)[Y_class_pred],
                     X._extract_view(vue)[Y_class_pred],
                     s=160, edgecolors='orange', linewidths=2, label="class prediction: "+str(index))


if __name__ == '__main__':
    # file = get_dataset_path("digit_histogram.npy")
    file = get_dataset_path("digit_col_grad.npy")
    y = np.load(get_dataset_path("digit_y.npy"))
    base_estimator = DecisionTreeClassifier(max_depth=4)
    dic_digit = load_dict(file)
    XX =MultiModalArray(dic_digit)
    X_train, X_test, y_train, y_test = train_test_split(XX, y)

    est2 = MumboClassifier(base_estimator=base_estimator).fit(X_train, y_train)
    y_pred2 = est2.predict(X_test)
    y_pred22 = est2.predict(X_train)
    print("result of MumboClassifier on digit ")
    result2 = np.mean(y_pred2.ravel() == y_test.ravel()) * 100
    print(result2)

    fig = plt.figure(figsize=(12., 11.))
    fig.suptitle("Mumbo: result" + str(result2), fontsize=16)
    plot_subplot(X_train, y_train, y_pred22 , 0, (4, 1, 1), "train vue 0" )
    plot_subplot(X_test, y_test,y_pred2, 0, (4, 1, 2), "test vue 0" )
    plot_subplot(X_test, y_test, y_pred2, 1, (4, 1, 3), "test vue 1" )
    plot_subplot(X_test, y_test,y_pred2, 2, (4, 1, 4), "test vue 2" )
    # plt.legend()
    plt.show()
Total running time of the script: ( 0 minutes 6.374 seconds)