Note
Click here to download the full example code
MVML
Demonstration on how MVML (in file mvml.py) is intended to be used with very simple simulated dataset
Demonstration uses scikit-learn for retrieving datasets and for calculating rbf kernel function, see http://scikit-learn.org/stable/
import numpy as np
import matplotlib.pyplot as plt
from sklearn import datasets
from sklearn.metrics import accuracy_score
from sklearn.metrics.pairwise import rbf_kernel
from multimodal.kernels.mvml import MVML
from multimodal.datasets.data_sample import DataSample
from multimodal.tests.datasets.get_dataset_path import get_dataset_path
np.random.seed(4)
# =========== create a simple dataset ============
n_tot = 200
half = int(n_tot/2)
n_tr = 120
# create a bit more data than needed so that we can take "half" amount of samples for each class
X0, y0 = datasets.make_moons(n_samples=n_tot+2, noise=0.3, shuffle=False)
X1, y1 = datasets.make_circles(n_samples=n_tot+2, noise=0.1, shuffle=False)
# make multi-view correspondence (select equal number of samples for both classes and order the data same way
# in both views)
yinds0 = np.append(np.where(y0 == 0)[0][0:half], np.where(y0 == 1)[0][0:half])
yinds1 = np.append(np.where(y1 == 0)[0][0:half], np.where(y1 == 1)[0][0:half])
X0 = X0[yinds0, :]
X1 = X1[yinds1, :]
Y = np.append(np.zeros(half)-1, np.ones(half)) # labels -1 and 1
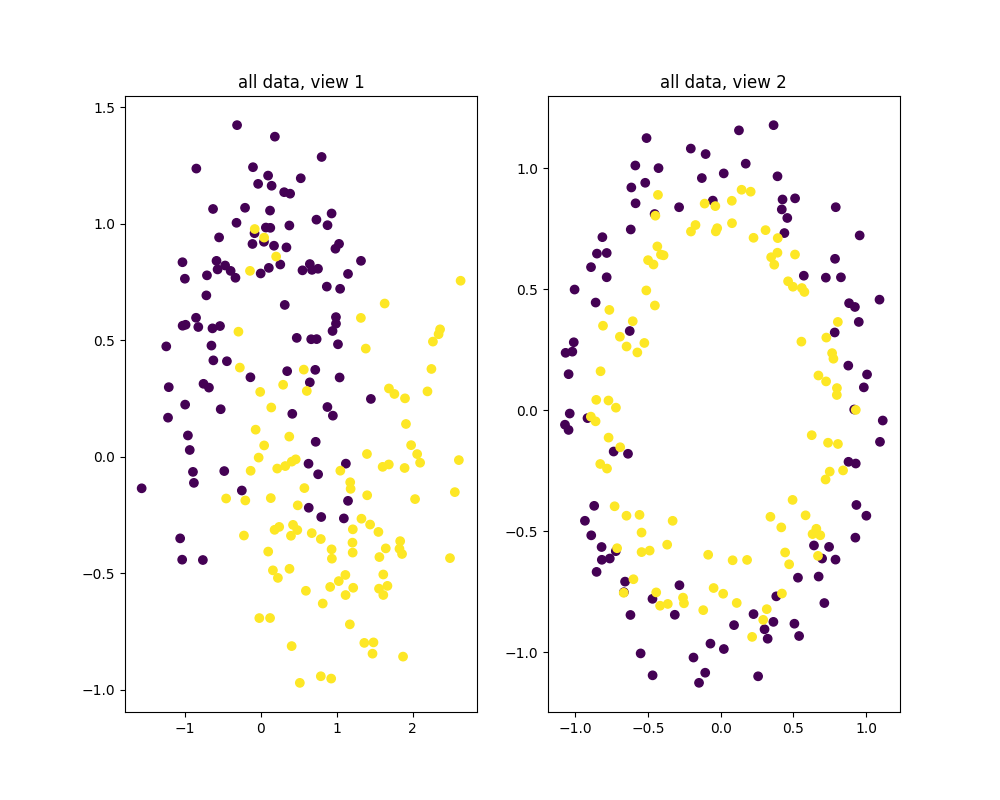
# show data
plt.figure(figsize=(10., 8.))
plt.subplot(121)
plt.scatter(X0[:, 0], X0[:, 1], c=Y)
plt.title("all data, view 1")
plt.subplot(122)
plt.scatter(X1[:, 0], X1[:, 1], c=Y)
plt.title("all data, view 2")
plt.show()
# shuffle
order = np.random.permutation(n_tot)
X0 = X0[order, :]
X1 = X1[order, :]
Y = Y[order]

Out:
/home/dominique/projets/ANR-Lives/scikit-multimodallearn/examples/mvml/plot_mvml_.py:73: UserWarning: Matplotlib is currently using agg, which is a non-GUI backend, so cannot show the figure.
  plt.show()
make kernel dictionaries
kernel_dict = {}
test_kernel_dict = {}
kernel_dict[0] = rbf_kernel(X0[0:n_tr, :])
kernel_dict[1] = rbf_kernel(X1[0:n_tr, :])
test_kernel_dict[0] = rbf_kernel(X0[n_tr:n_tot, :], X0[0:n_tr, :])
test_kernel_dict[1] = rbf_kernel(X1[n_tr:n_tot, :], X1[0:n_tr, :])
x_dict = {}
x_dict[0] = X0[0:n_tr, :]
x_dict[1] = X1[0:n_tr, :]
test_x_dict = {}
test_x_dict[0] = X0[n_tr:n_tot, :]
test_x_dict[1] = X1[n_tr:n_tot, :]
# d= DataSample(kernel_dict)
# a = d.data
#
# =========== use MVML in classifying the data ============
#  kernel precomputed
# demo on how the code is intended to be used; parameters are not cross-validated, just picked some
# # with approximation
# # default: learn A, don't learn w   (learn_A=1, learn_w=0)
mvml = MVML(lmbda=0.1, eta=1, nystrom_param=0.2, kernel='precomputed')
mvml.fit(kernel_dict, Y[0:n_tr])


#

pred1 = mvml.predict(test_kernel_dict)
#
# without approximation
mvml2 = MVML(lmbda=0.1, eta=1, nystrom_param=1, kernel='precomputed')   # without approximation
mvml2.fit(kernel_dict, Y[0:n_tr])
pred2 = mvml2.predict(test_kernel_dict)
#
# use MVML_Cov, don't learn w
mvml3 = MVML(lmbda=0.1, eta=1,learn_A=3, nystrom_param=1, kernel='precomputed')
mvml3.fit(kernel_dict, Y[0:n_tr])
pred3 = mvml3.predict(test_kernel_dict)
#
# use MVML_I, don't learn w
mvml4 = MVML(lmbda=0.1, eta=1,learn_A=4, nystrom_param=1, kernel='precomputed')
mvml4.fit(kernel_dict, Y[0:n_tr])
pred4 = mvml4.predict(test_kernel_dict)
#
# use kernel rbf equivalent to case 1
mvml5 = MVML(lmbda=0.1, eta=1, nystrom_param=0.2, kernel='rbf')
mvml5.fit(x_dict, Y[0:n_tr])
pred5 = mvml5.predict(test_x_dict)
#
#
# # =========== show results ============
#
# # accuracies
acc1 = accuracy_score(Y[n_tr:n_tot], pred1)
acc2 = accuracy_score(Y[n_tr:n_tot], pred2)
acc3 = accuracy_score(Y[n_tr:n_tot], pred3)
acc4 = accuracy_score(Y[n_tr:n_tot], pred4)
acc5 = accuracy_score(Y[n_tr:n_tot], pred5)
#
# # display obtained accuracies
#
print("MVML:       ", acc1)
print("MVMLsparse: ", acc2)
print("MVML_Cov:   ", acc3)
print("MVML_I:     ", acc4)
print("MVML_rbf:   ", acc5)
#
#
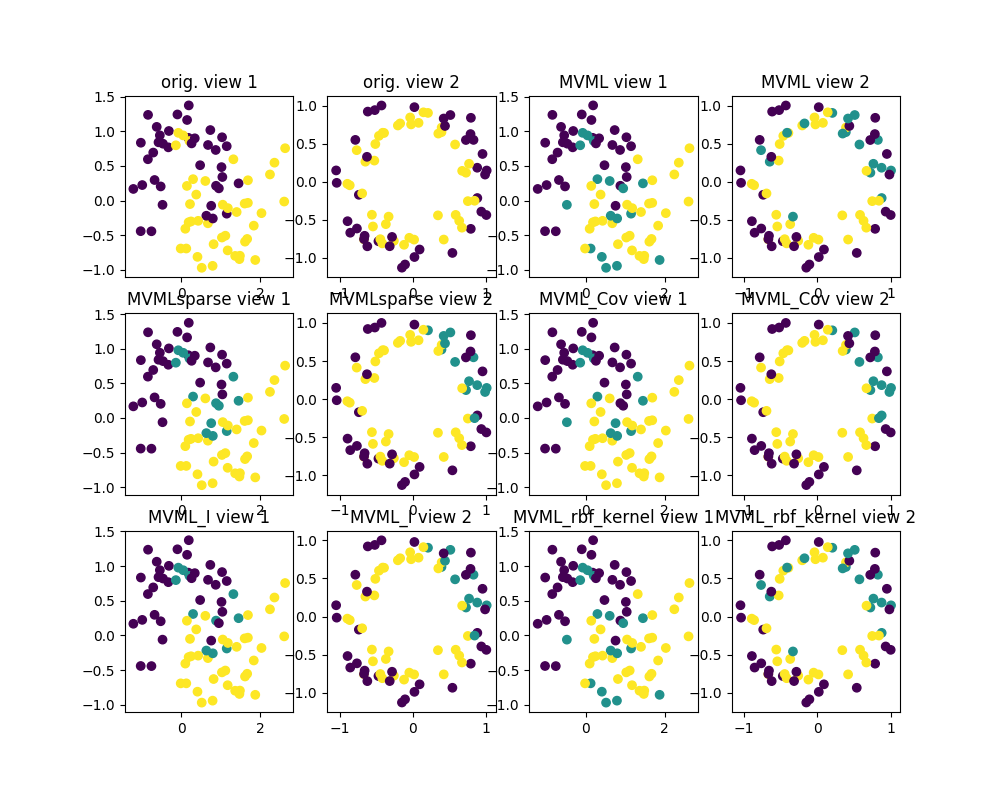
# # plot data and some classification results
#
plt.figure(2, figsize=(10., 8.))
plt.subplot(341)
plt.scatter(X0[n_tr:n_tot, 0], X0[n_tr:n_tot, 1], c=Y[n_tr:n_tot])
plt.title("orig. view 1")
plt.subplot(342)
plt.scatter(X1[n_tr:n_tot, 0], X1[n_tr:n_tot, 1], c=Y[n_tr:n_tot])
plt.title("orig. view 2")
#
pred1[np.where(pred1[:] != Y[n_tr:n_tot])] = 0
pred1 = pred1.reshape((pred1.shape[0]))
plt.subplot(343)
plt.scatter(X0[n_tr:n_tot, 0], X0[n_tr:n_tot, 1], c=pred1)
plt.title("MVML view 1")
plt.subplot(344)
plt.scatter(X1[n_tr:n_tot, 0], X1[n_tr:n_tot, 1], c=pred1)
plt.title("MVML view 2")
#
pred2[np.where(pred2[:] != Y[n_tr:n_tot])] = 0
pred2 = pred2.reshape((pred2.shape[0]))
plt.subplot(345)
plt.scatter(X0[n_tr:n_tot, 0], X0[n_tr:n_tot, 1], c=pred2)
plt.title("MVMLsparse view 1")
plt.subplot(346)
plt.scatter(X1[n_tr:n_tot, 0], X1[n_tr:n_tot, 1], c=pred2)
plt.title("MVMLsparse view 2")
#
pred3[np.where(pred3[:] != Y[n_tr:n_tot])] = 0
pred3 = pred3.reshape((pred3.shape[0]))
#
plt.subplot(347)
plt.scatter(X0[n_tr:n_tot, 0], X0[n_tr:n_tot, 1], c=pred3)
plt.title("MVML_Cov view 1")
plt.subplot(348)
plt.scatter(X1[n_tr:n_tot, 0], X1[n_tr:n_tot, 1], c=pred3)
plt.title("MVML_Cov view 2")
#
pred4[np.where(pred4[:] != Y[n_tr:n_tot])] = 0
pred4 = pred4.reshape((pred4.shape[0]))
plt.subplot(349)
plt.scatter(X0[n_tr:n_tot, 0], X0[n_tr:n_tot, 1], c=pred4)
plt.title("MVML_I view 1")
plt.subplot(3,4,10)
plt.scatter(X1[n_tr:n_tot, 0], X1[n_tr:n_tot, 1], c=pred4)
plt.title("MVML_I view 2")
#
pred5[np.where(pred5[:] != Y[n_tr:n_tot])] = 0
pred5 = pred5.reshape((pred5.shape[0]))
plt.subplot(3,4,11)
plt.scatter(X0[n_tr:n_tot, 0], X0[n_tr:n_tot, 1], c=pred5)
plt.title("MVML_rbf_kernel view 1")
plt.subplot(3,4,12)
plt.scatter(X1[n_tr:n_tot, 0], X1[n_tr:n_tot, 1], c=pred5)
plt.title("MVML_rbf_kernel view 2")
#
plt.show()

Out:
WARNING:root:warning appears during fit process{'precond_A': 1, 'precond_A_1': 1}
WARNING:root:warning appears during fit process{'precond_A': 1, 'precond_A_1': 4}
WARNING:root:warning appears during fit process{'precond_A': 1}
WARNING:root:warning appears during fit process{'precond_A_1': 1}
WARNING:root:warning appears during fit process{'precond_A': 1, 'precond_A_1': 1}
MVML:        0.7875
MVMLsparse:  0.8375
MVML_Cov:    0.85
MVML_I:      0.8625
MVML_rbf:    0.7875
/home/dominique/projets/ANR-Lives/scikit-multimodallearn/examples/mvml/plot_mvml_.py:206: UserWarning: Matplotlib is currently using agg, which is a non-GUI backend, so cannot show the figure.
  plt.show()
Total running time of the script: ( 0 minutes 3.630 seconds)